Introduction
Dashboard

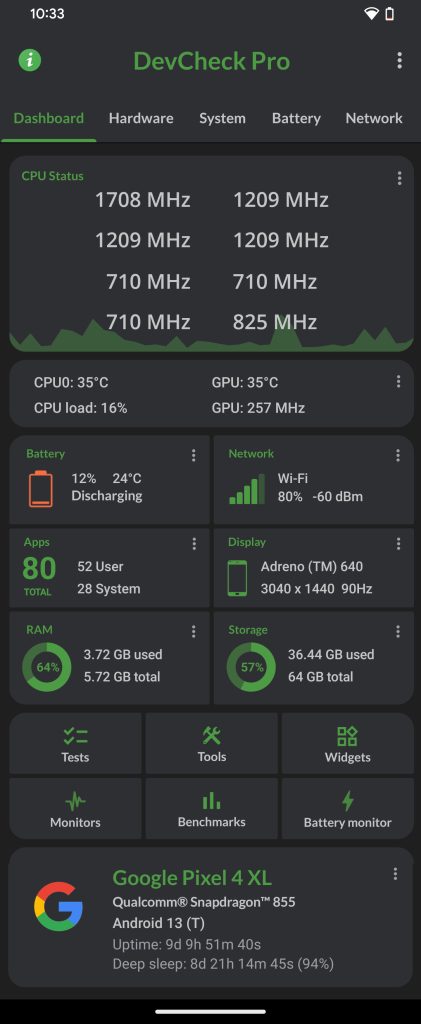
The Dashboard serves as DevCheck’s home screen, providing a real-time overview of your device
CPU Status shows the current frequency of each processor core overlaid on a graph of CPU usage. Tap to access detailed CPU time-in-state information
If available, temperatures, CPU load, and current GPU frequency are displayed. Access to this info requires root access on most devices. You can tap this card to select which temperature sensors you wish to display.
Below, you’ll find cards displaying the status of various hardware components. Tapping on any of these cards will provide a brief summary and a direct link to the relevant system settings
Buttons are available for Tests, Tools, Widgets, Floating Monitors, Benchmarks, and Battery Monitor. Please note that some of these features require DevCheck Pro
Lastly, at the bottom of the Dashboard, you’ll find your device’s brand name, SOC (System on Chip), and Android version. Uptime represents the duration since the device was last rebooted. Directly below, you’ll find the amount of time the device has spent in deep sleep mode, conserving power when not in active use